Mean-Shift Clustering
Problem Statement
Given:
- A continuously updated set of 2D points \(P = \{p_1, p_2, \dots, p_n\}\) representing the locations (latitude, longitude) of people.
- A fixed radius \(r = 100\) meters.
Objective:
- Continuously identify the coordinate \(c\) **such that the circle of radius 100 m centred at \(c\)contains the maximum number of points from P. The solution must be updated in near real time as new points are added (or removed).
Mean-Shift Clustering
- Centroid Based Clustering
- Unlike K-means you don’t have to specify the number of clusters
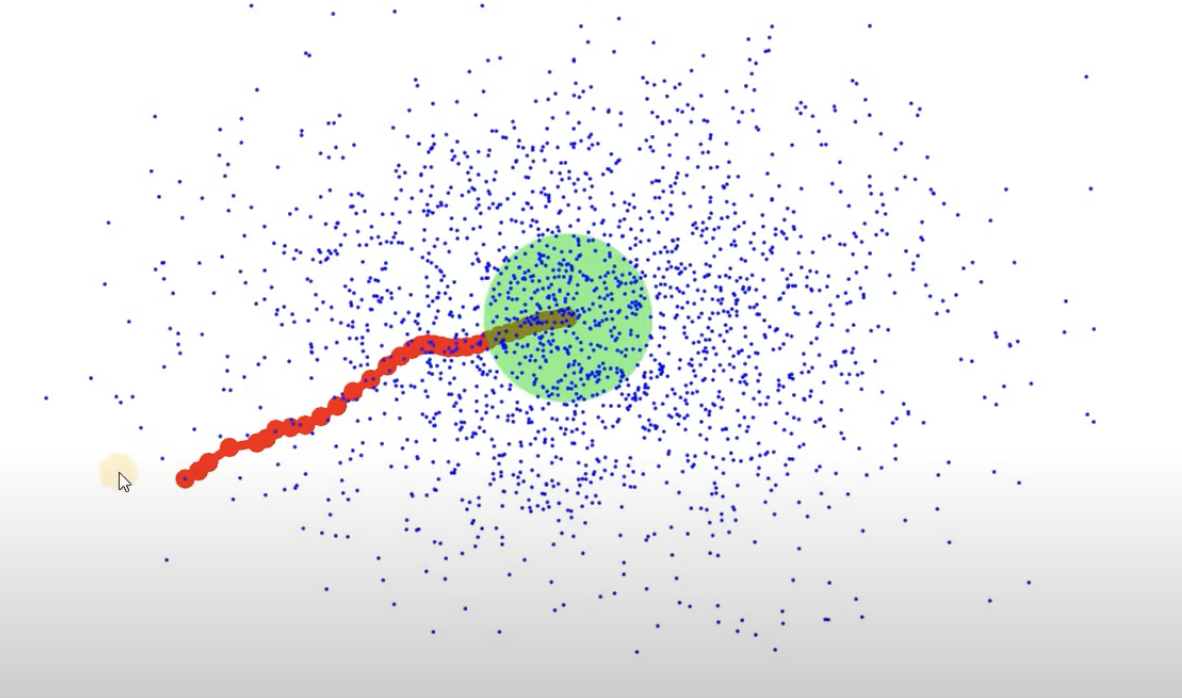
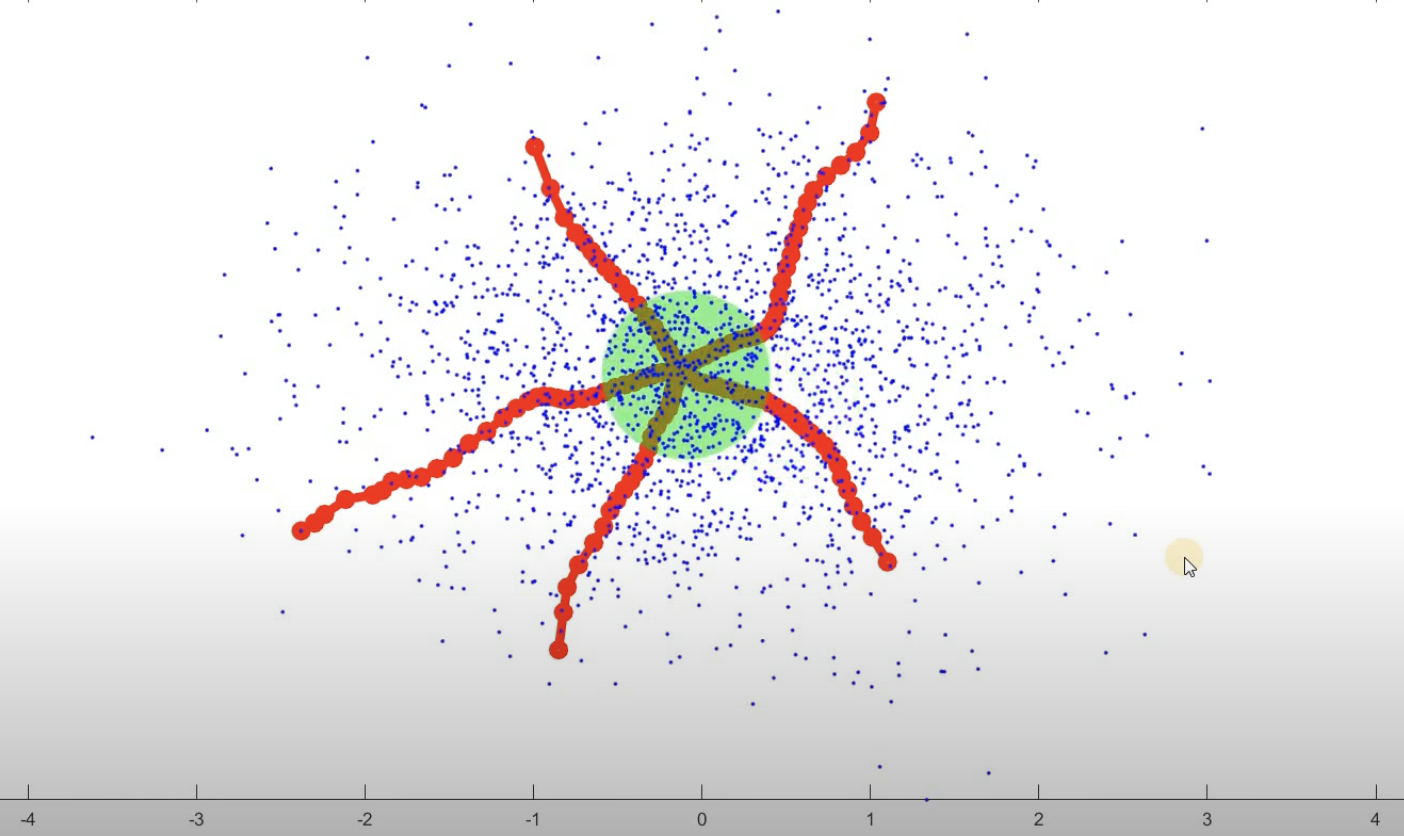
- Assigns the data points to the clusters iteratively by shifting points towards the mode (⇒ highest density of data points in the region)
- Given a set of data points, the algorithm iteratively assigns each data point towards where the most points are at ⇒ cluster centre
- \(O(n^2)\) ⇒ not that efficient
- Key parameters;
- Bandwidth: neighbourhood size
- Bandwidth is too high ⇒ less clusters that is very huge
- Bandwidth is too low ⇒ too many clusters that are small (may not even be clusters)
Procedure
-
Initialize centroids. Start with a set of data points as candidate centroids. (all points are centroids) (?? can this be changed?)
-
Shift towards the dense part. For each centroid, compute the mean of all points within a given bandwidth → move the centroid towards this mean. Repeat until it converges (similar to previous point).
-
Merge close centroids. When they stop moving significantly, similar ones are merged.
-
Assign points to clusters (each convergence is a corresponding cluster). Each data point is assigned to the closest centroid.
Clustering
import matplotlib.pyplot as plt
from sklearn.cluster import MeanShift, estimate_bandwidth
from sklearn.datasets import make_blobs
X, _ = make_blobs(n_samples=300, centers=3, cluster_std=0.5, random_state=0)
bandwidth = estimate_bandwidth(X, quantile=0.2, n_samples=100)
ms = MeanShift(bandwidth=bandwidth)
ms.fit(X)
labels = ms.labels_
cluster_centers = ms.cluster_centers_
plt.scatter(X[:, 0], X[:, 1], c=labels, cmap='viridis', alpha=0.7)
plt.scatter(cluster_centers[:, 0], cluster_centers[:, 1], c='red', marker='X', s=200, label="Centroids")
plt.legend()
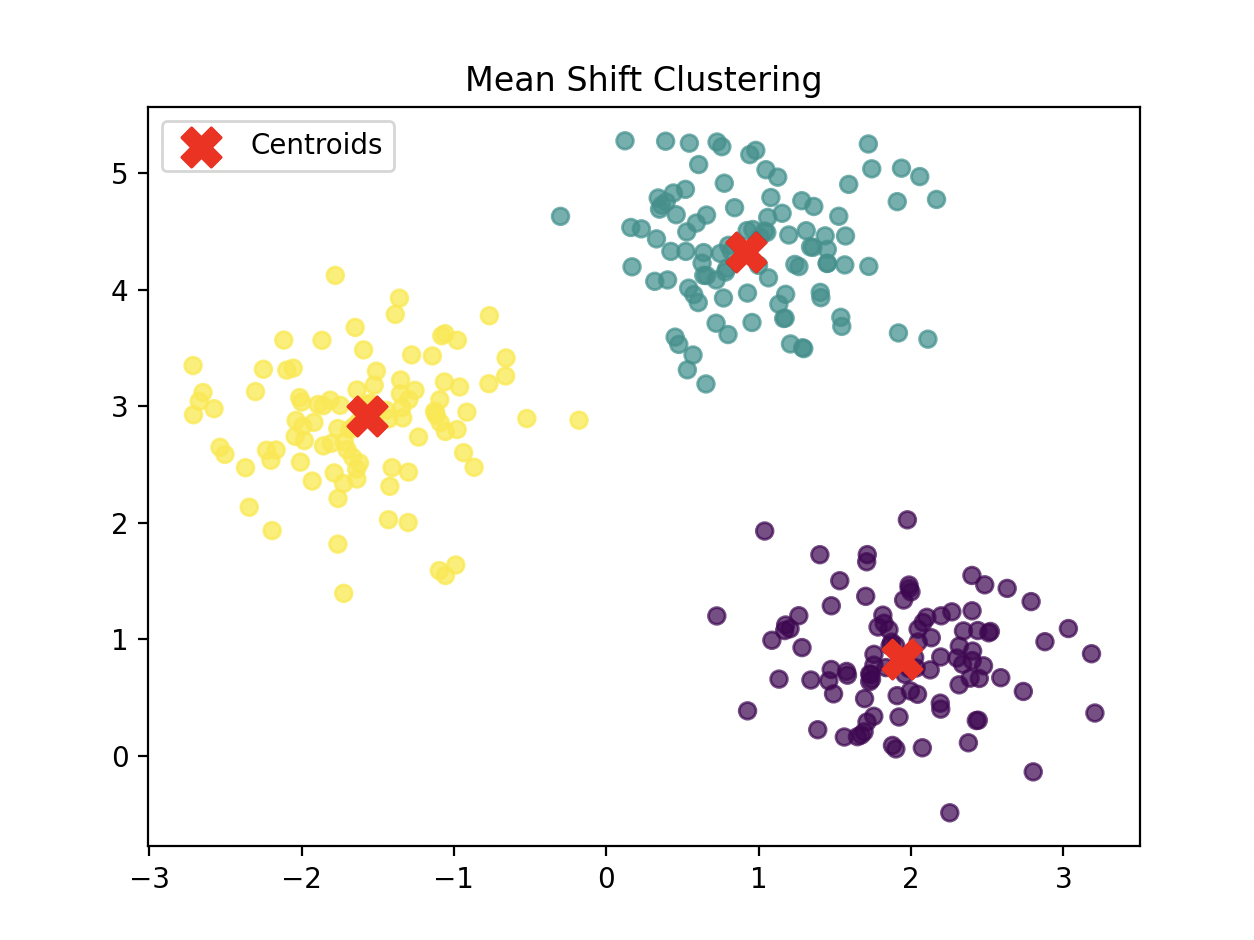
plt.title("Mean Shift Clustering")
plt.show()
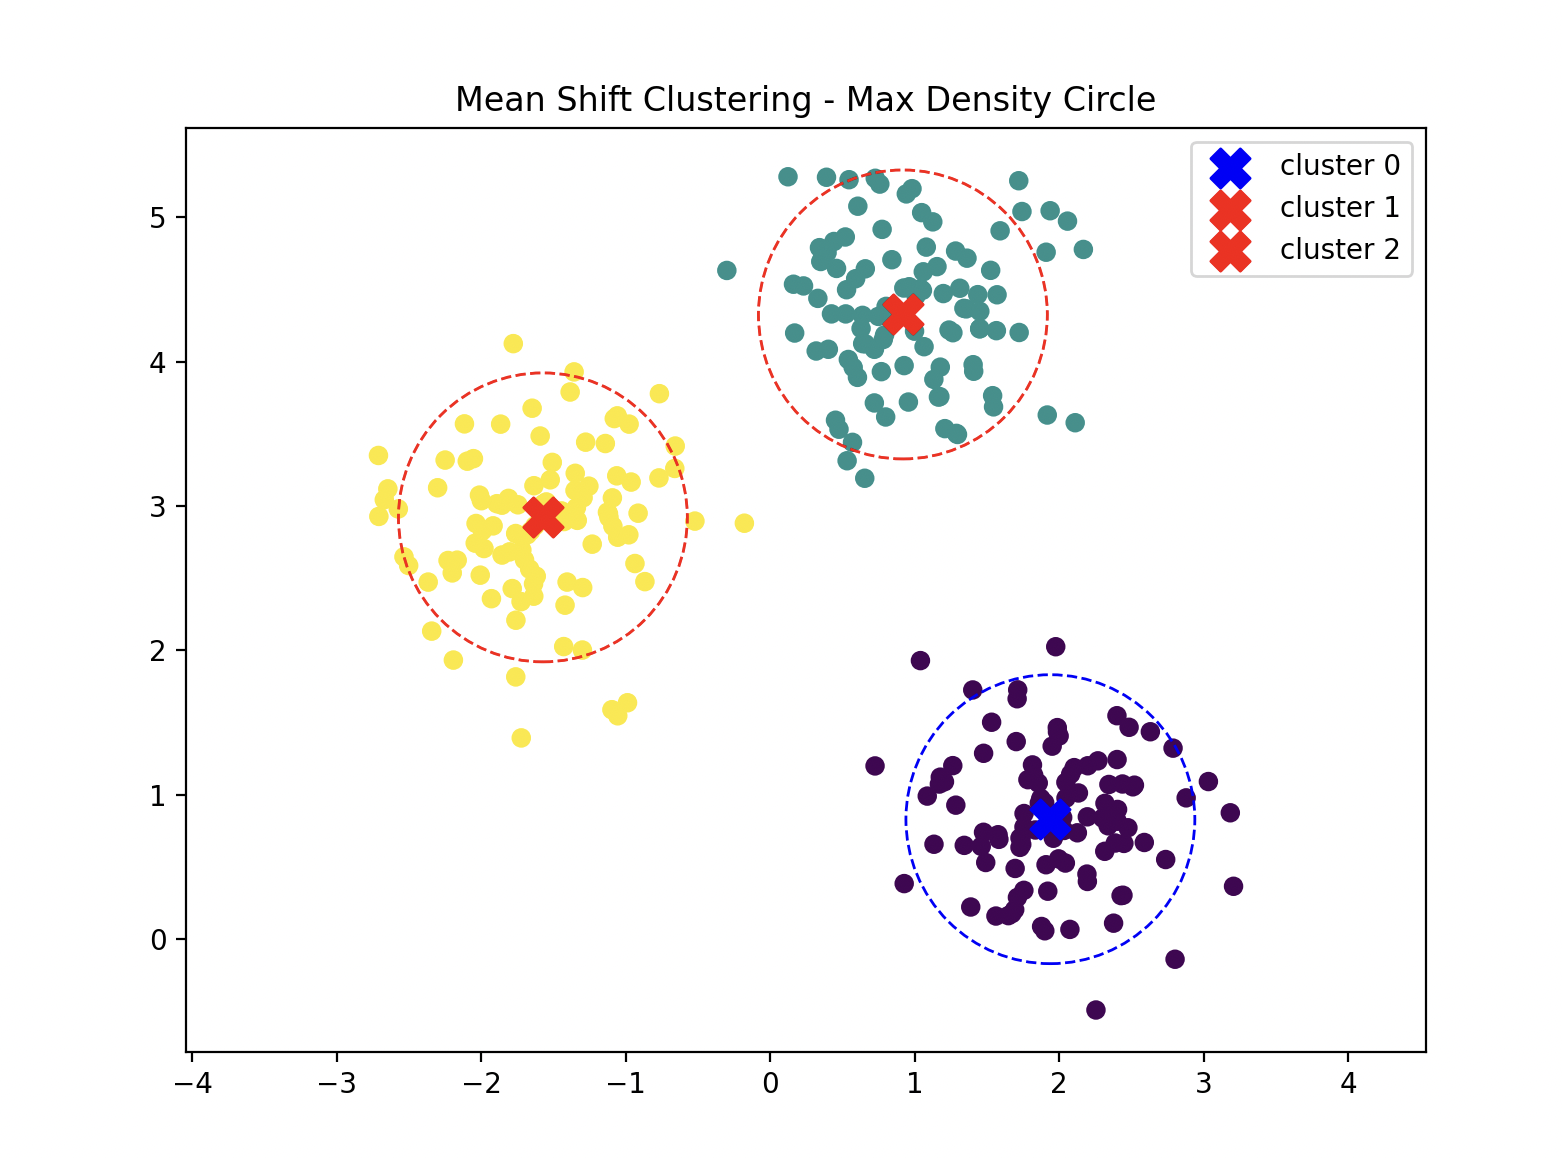
Find the Densest Cluster
import numpy as np
import matplotlib.pyplot as plt
from sklearn.cluster import MeanShift, estimate_bandwidth
from sklearn.datasets import make_blobs
from scipy.spatial import distance

X, _ = make_blobs(n_samples=300, centers=3, cluster_std=0.5, random_state=0)

bandwidth = estimate_bandwidth(X, quantile=0.2, n_samples=100)
ms = MeanShift(bandwidth=bandwidth)
ms.fit(X)
labels = ms.labels_
centers = ms.cluster_centers_

radius = 1
pt_counts = {}

for l, c in enumerate(centers):
    count = np.sum(distance.cdist([c], X, 'euclidean')[0] <= radius)
    pt_counts[l] = count
    print(f"cluster {l}: {c} [{count}]")

max_dens_cluster = max(pt_counts, key=pt_counts.get)
max_dens_pt = centers[max_dens_cluster]

plt.figure(figsize=(8, 6))
plt.scatter(X[:, 0], X[:, 1], c=labels, cmap='viridis')

for l, c in enumerate(centers):
    markerC = 'red' if l != max_dens_cluster else 'blue'
    plt.scatter(c[0], c[1], c=markerC, marker='X', s=200, label=f"cluster {l}")

    circle = plt.Circle(c, radius, color=markerC, fill=False, linestyle='dashed')
    plt.gca().add_patch(circle)

plt.axis('equal')
plt.title("Mean Shift Clustering - Max Density Circle")
plt.legend()
plt.show()