DBSCAN
Problem Statement
Given:
- A continuously updated set of 2D points \(P = \{p_1, p_2, \dots, p_n\}\) representing the locations (latitude, longitude) of people.
- A fixed radius \(r = 100\) meters.
Objective:
- Continuously identify the coordinate \(c\) **such that the circle of radius 100 m centred at \(c\)contains the maximum number of points from P. The solution must be updated in near real time as new points are added (or removed).
DBSCAN
- Density Based Spatial Clustering of Applications with Noise
- Clustering algorithm used in ML to partition data into clusters based on their distance to other points.
- Effective at identifying and removing noise (outliers) in a data set.
- Complexity depends on how the nearest neighbour search is implemented.
- Brute Force Search: \(O(n^2)\)
- Tree (k-dimensional tree, ball tree, r-tree): \(O(n \: logn)\)
- scikit-learn allows diff searching algorithms
- Key parameters:
- eps: radius of the “neighbourhood”
- MinPts: minimum # of points required within the eps radius to be considered as a core point.
- If esp is too high ⇒ a lot of points are considered as 1 cluster
- If esp is too low ⇒ points may be divided in to too many clusters and a lot of them could be considered as outliers.
- If minPts is too high ⇒ cut off is too high so there might be less clusters and a lot of outliers.
- If minPts is too low ⇒ outliers can be considered as clusters
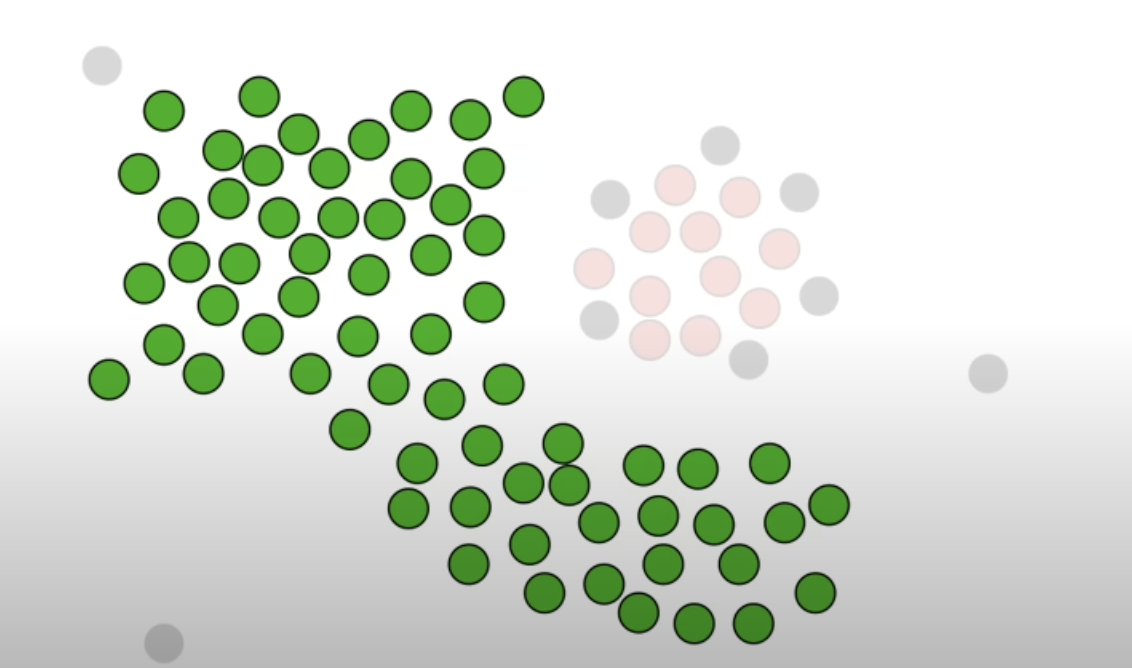
Procedure
-
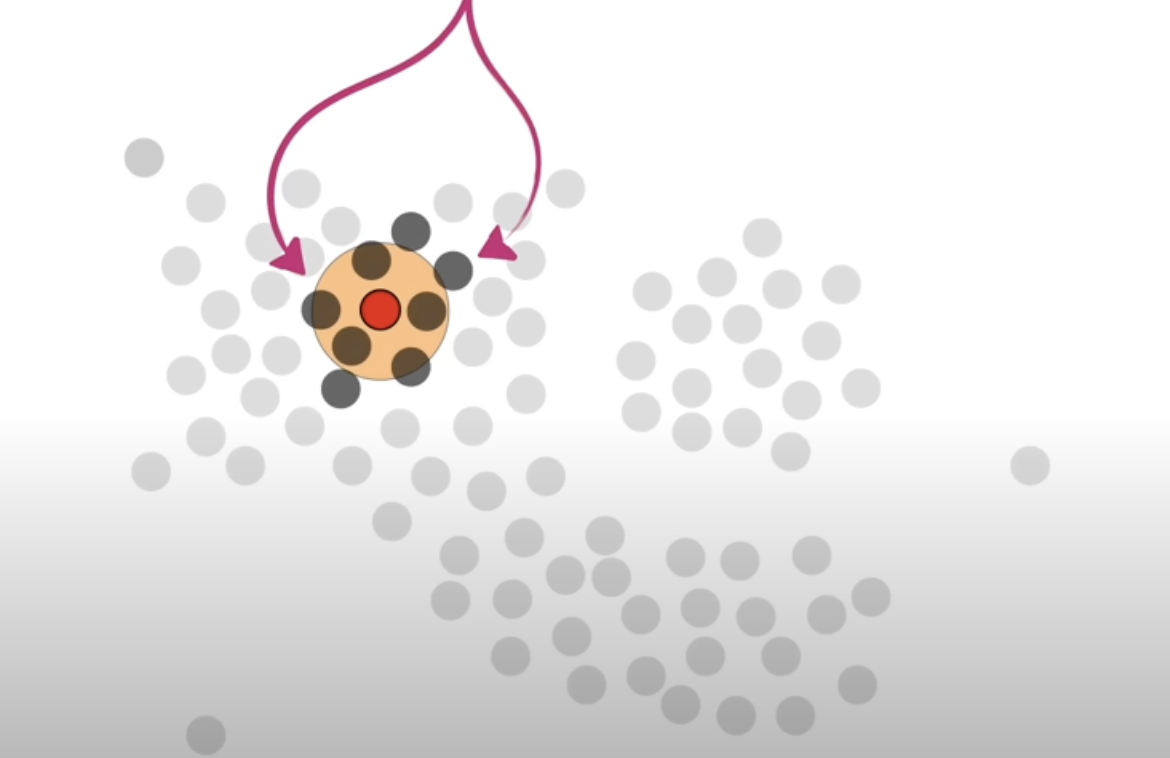
Parameter: radius and the min. neighbour points
-
Determine if this point is a core point or not
- if the radius was 10m and the min neighbour points was 4, a point that has at least 4 other points within the 10m radius circle (can be touching the circle, doesn’t have to be fully inside), it is considered a core point.
- if the radius was 10m and the min neighbour points was 4, a point that has at least 4 other points within the 10m radius circle (can be touching the circle, doesn’t have to be fully inside), it is considered a core point.
-
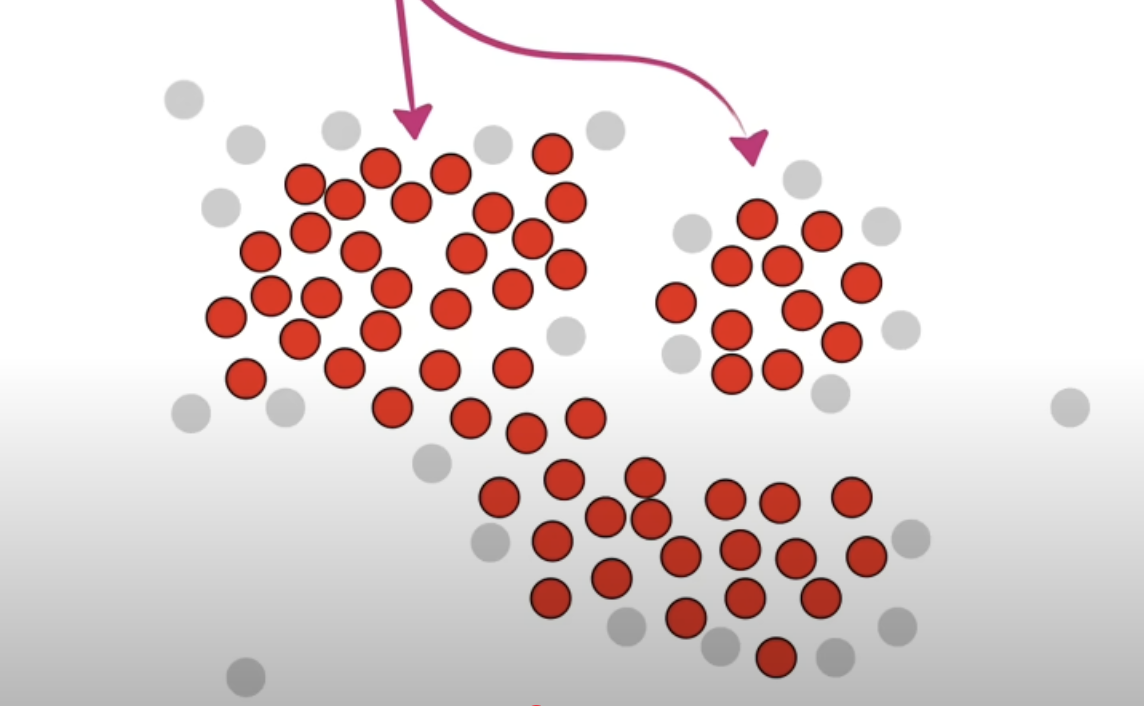
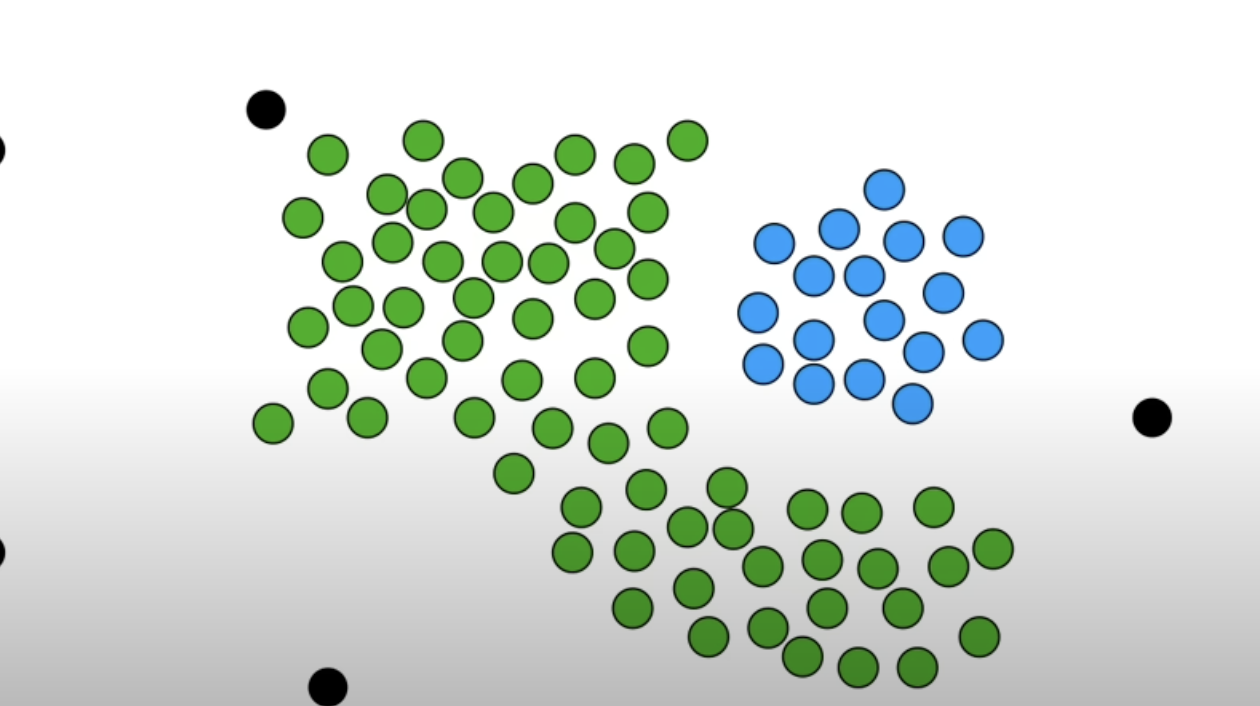
Randomly pick a core point and put it into cluster 1. And in the neighbour points, if there are other core points, put them into cluster 1 as well. Do not include the non core points. Repeat until there are no more core points that can be extended to.
-
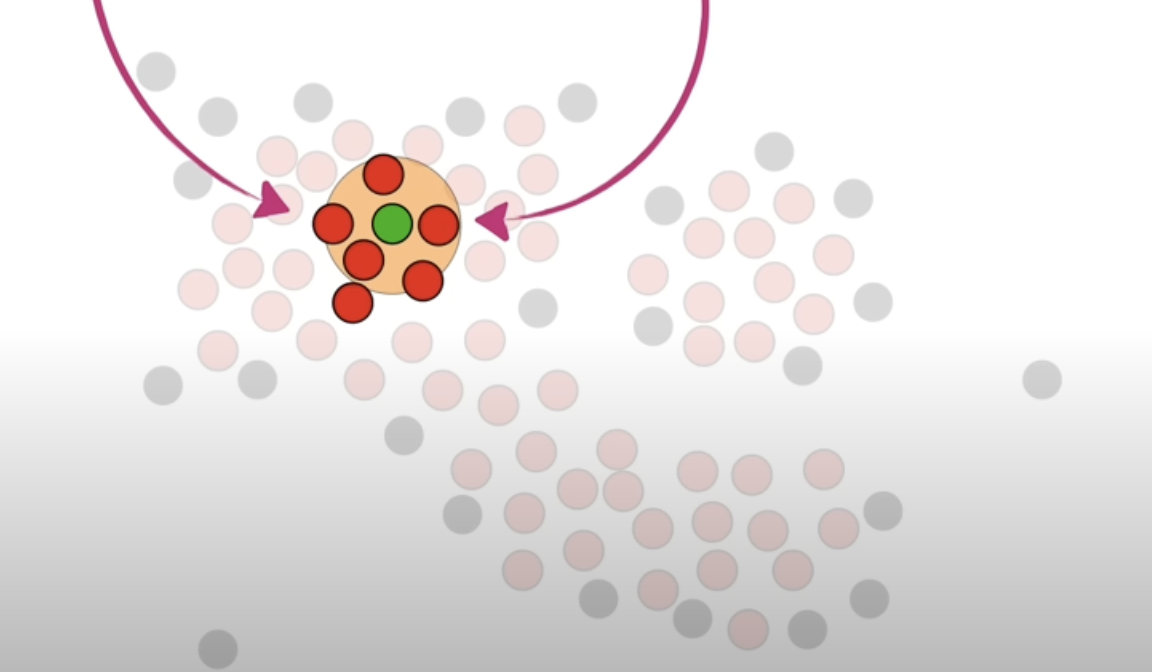
Add the non core points that are neighbours of the core points that are classified as cluster 1.
-
Other core points that was not “connected” to the core points classified as cluster 1 becomes a new cluster, ie cluster 2. Repeat the step until there are no more core points left.
-
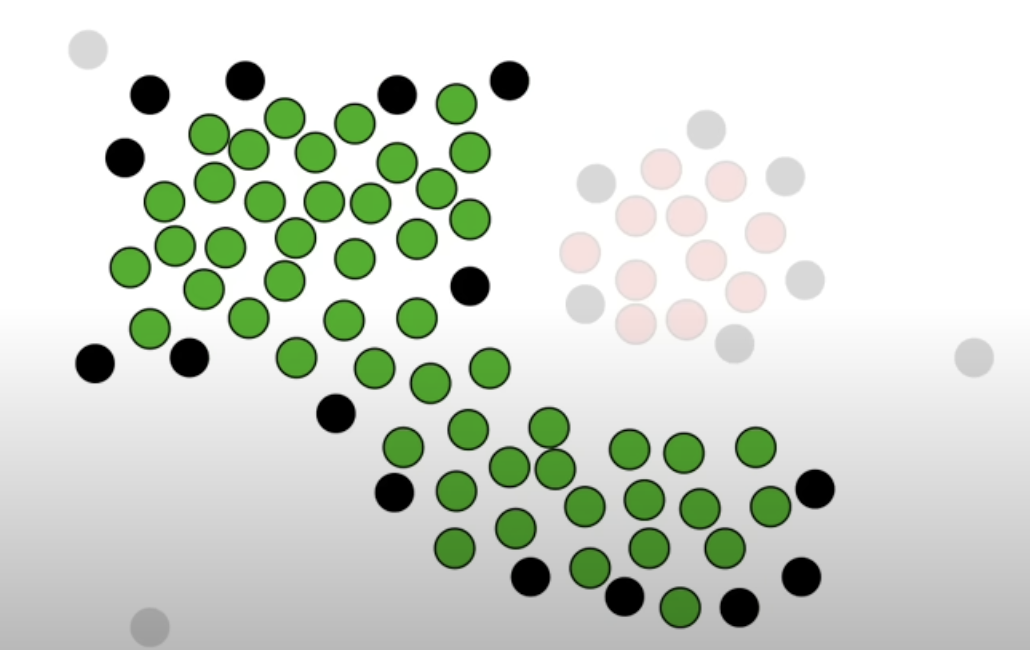
After grouping with the core points, if there are non core points left, they are classified as outliers.
Pseudocode
DBSCAN(dataset, eps, MinPts) {
    C = 1 # cluster index

    for each unvisited point p in dataset {
        mark p as visited

        # find all the points within a distance eps from point p
        Neighbours N = find the neigbouring points of p

        if |N| >= MinPts:
            N = N U newN # expand the neigbours (=> add the neigbours neighbour if they're core points)
            if newP is not a member of any cluster:
                add newP to cluster C # here the newP is the neighbours)
    }
}
Algorithm Implementation with Python
import numpy as np

def find_neighbours(data, point_idx, eps):
    neighbours = []
    for i in range(len(data)):
        if np.linalg.norm(data[point_idx] - data[i]) <= eps:
            neighbours.append(i)
    return neighbours

def dbscan(data, eps, min_pts):
    clusters = [-1] * len(data)
    cluster_id = 0

    for i in range(len(data)):
        if clusters[i] != -1:
            continue

        neighbours = find_neighbours(data, i, eps)

        if len(neighbors) < min_pts:
            clusters[i] = 0
            continue

        cluster_id += 1
        clusters[i] = cluster_id
        queue = neighbours

        while queue:
            j = queue.pop(0)

            if clusters[j] == 0:
                clusters[j] = cluster_id

            if clusters[j] != -1:
                continue

            clusters[j] = cluster_id
            new_neighbours = find_neighbours(data, j, eps)

            if len(new_neighbors) >= min_pts:
                queue.extend(new_neighbors)

    return clusters

data = np.array([[1, 2], [2, 2], [3, 2], [8, 7], [8, 8], [25, 80]])
eps = 2
min_pts = 2

clusters = dbscan(data, eps, min_pts)
print(clusters)
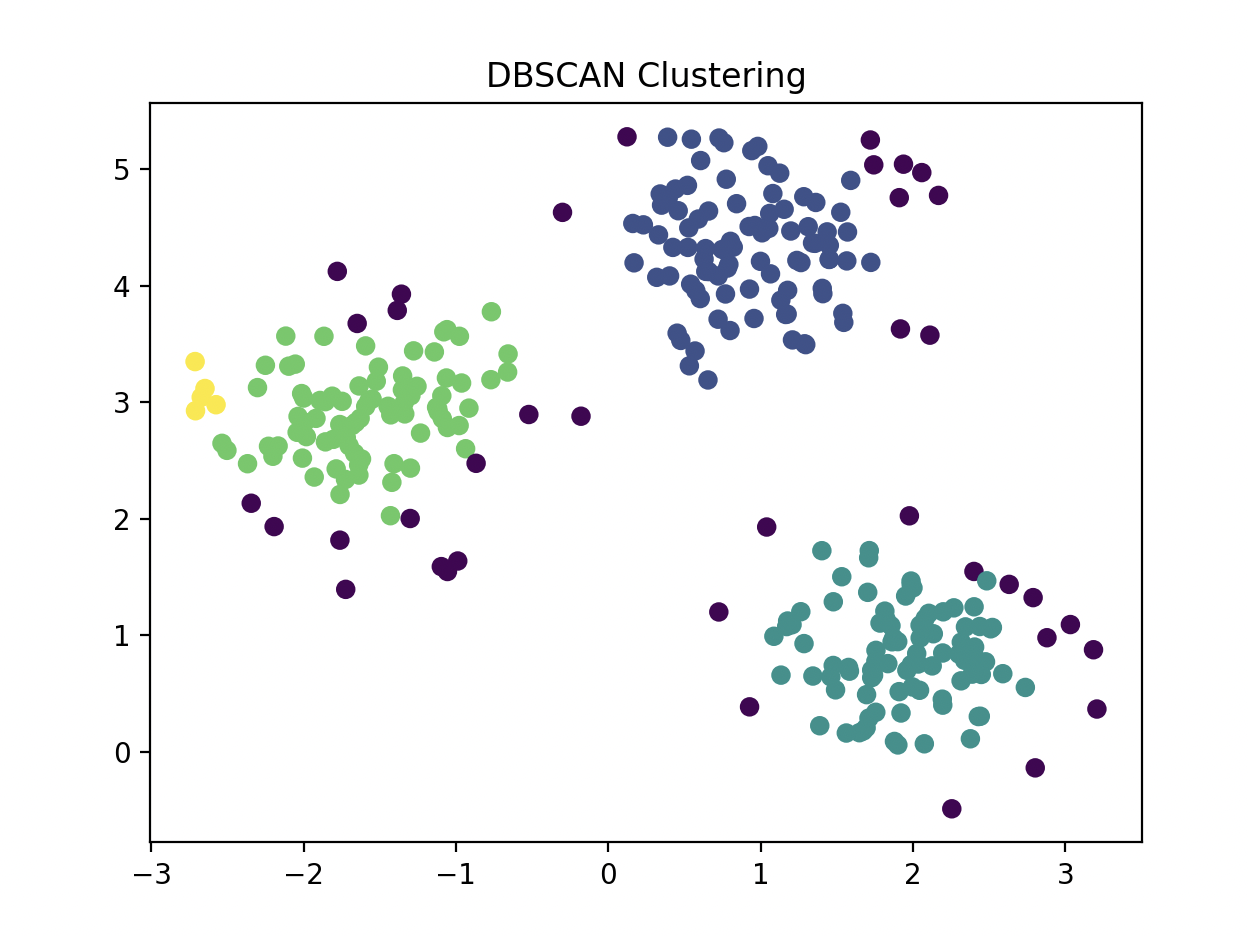
Clustering
import matplotlib.pyplot as plt
from sklearn.cluster import DBSCAN
from sklearn.datasets import make_blobs

X, _ = make_blobs(n_samples=300, centers=3, cluster_std=0.5, random_state=0)

db = DBSCAN(eps=0.3, min_samples=5).fit(X)
labels = db.labels_

print(labels)

plt.scatter(X[:, 0], X[:, 1], c=labels, cmap='viridis', edgecolors='k')
plt.title("DBSCAN Clustering")
plt.show()
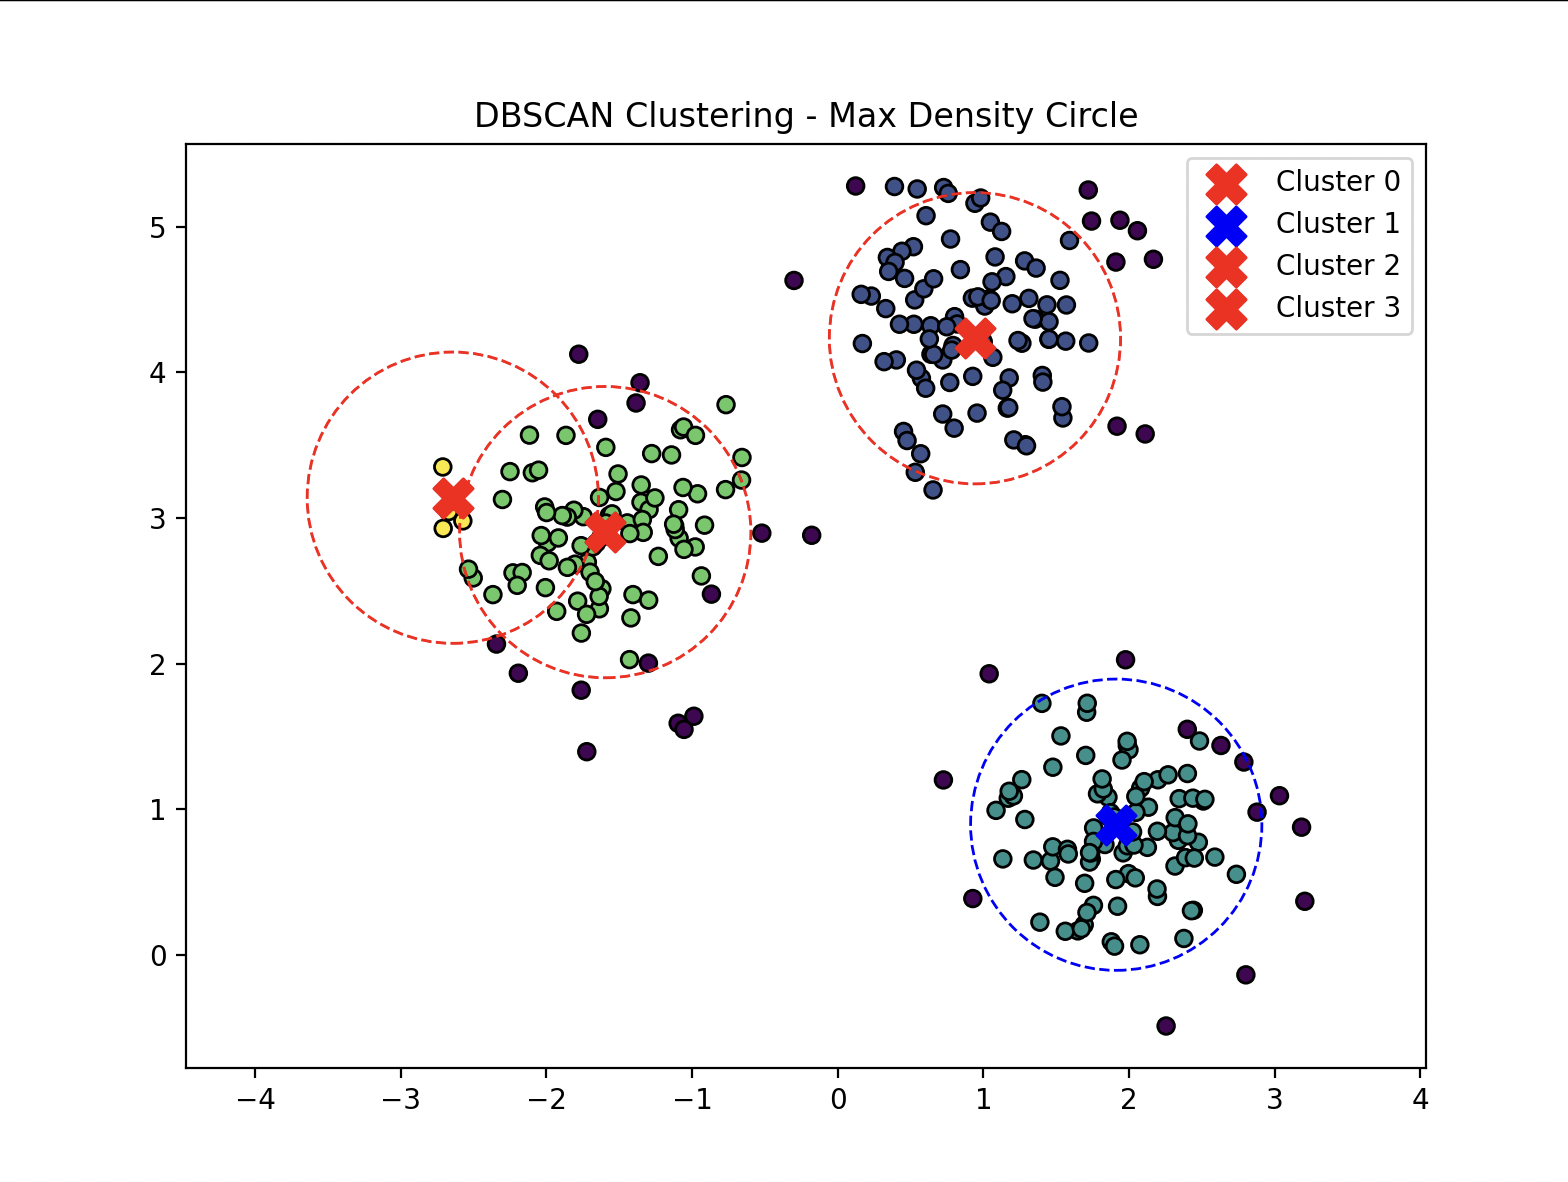
Find the Densest Cluster
- Calculates the centre point of each cluster then counts the number of points inside.
import numpy as np
import matplotlib.pyplot as plt
from sklearn.cluster import DBSCAN
from sklearn.datasets import make_blobs
from scipy.spatial import distance

X, _ = make_blobs(n_samples=300, centers=3, cluster_std=0.5, random_state=0)

db = DBSCAN(eps=0.3, min_samples=5).fit(X)
labels = db.labels_

unique_labels = set(labels) - {-1}
centers = []

for l in unique_labels:
    mask_bool = (labels == l)
    cluster_points = X[mask_bool]

    x_min = np.min(cluster_points[:, 0])
    x_max = np.max(cluster_points[:, 0])
    y_min = np.min(cluster_points[:, 1])
    y_max = np.max(cluster_points[:, 1])

    center_pt = np.array([(x_min + x_max) / 2, (y_min + y_max) / 2])
    centers.append((l, center_pt))

radius = 1
pt_counts = {}

for l, c in centers:
    count = np.sum(distance.cdist([c], X, 'euclidean')[0] <= radius)
    pt_counts[l] = count
    print(f"cluster {l}: {c} [{count}]")

max_dens_cluster = max(pt_counts, key=pt_counts.get)
max_dens_pt = dict(centers)[max_dens_cluster]

plt.figure(figsize=(8, 6))
plt.scatter(X[:, 0], X[:, 1], c=labels, cmap='viridis', edgecolors='k')

for l, c in centers:
    markerC = 'red' if l != max_dens_cluster else 'blue'
    plt.scatter(c[0], c[1], c=markerC, marker='X', s=200, label=f"Cluster {l}")

    circle = plt.Circle(c, radius, color=markerC, fill=False, linestyle='dashed')
    plt.gca().add_patch(circle)

plt.axis('equal')
plt.title("DBSCAN Clustering - Max Density Circle")
plt.legend()
plt.show()